Liver Iron Quantification
Overview
To calculate T2* (or R2*, which is its inverse), a series of gradient-echo acquisitions through the liver is acquired with varying echo times. With longer echo times, the signal from the tissue decreases as a consequence of T2* decay. A simple curve fit of intensity values yields the exponential decay constant. Ferromagnetic substrates affect T2* decay, and so liver iron concentration can be calculated if the T2* decay constant of the hepatic parenchyma is known.
ROI Placement
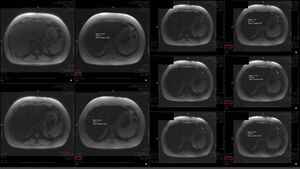
There is a liver iron quantification protocol that it occasionally used at SRC, but there is no associated software package. Instead, a calculator can be used. ROIs must be placed manually, and intensities and echo times must be input to the calculator. The following image is an example showing ROI placements. ROIs must be placed on in-phase only or on out-of-phase only images, which can be differentiated by the India ink artifact. Combining the two results in a poor curve fit and an erroneous result.

Quantification
The formulas for calculating liver iron concentration in mg Iron/g tissue from R2* or T2* are:
[Fe] = 0.0254 (mg/g/Hz) × R2* + 0.202 (mg/g)
[Fe] = 0.0254 (mg/g/Hz) / T2* + 0.202 (mg/g)
Normal liver iron concentration is 0.2-2.0 mg/g.
Wood JC, Enriquez C, Ghugre N et al. MRI R2 and R2* mapping accurately estimates hepatic iron concentration in transfusion-dependent thalassemia and sickle cell disease patients. Blood 2005;106(4):1460–1465.
Calculator
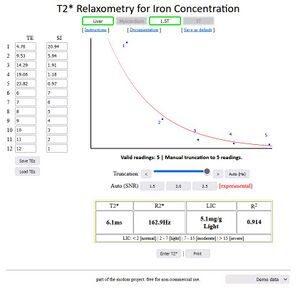
The following shows placement of the values in the calculator at http://www.isodense.com/ic/:

Please note that the correct magnet strength must be selected at the top! The calculator will perform the iron quantification calculation for you. It is good practice to observe the shape of the curve and to confirm that the quantitative result matches the qualitative result. In this case, the hepatic parenchymal signal on the initial out of phase image (TE 2.38, top left in the image above) is higher than the following in-phase image (TE 4.76, top row, second from the left in the image above). The T2* decay due to excessive iron is causing decay so rapid that it overcomes the typically observed increase in signal on the in-phase acquisition due to chemical shift suppresion of signal on the initial out-of-phase acquisition.